When it comes to “making it” on YouTube, many people tend to zero in on two key metrics. You look at how many subscribers your YouTube channel has, and you look at how many views your YouTube videos get. Unsurprisingly, these are also the kinds of stats that viewers might use to gauge the relative importance or popularity of a YouTuber, just as much as companies might review these stats in considering potential branded content and influencer marketing possibilities.
However, what you’ll quickly come to learn is that subscriber and view counts are largely vanity metrics. They’re nice to look at, but they ultimately don’t mean much if you can’t back them up with the metrics and analytics that actually matter. To that end, here are some key YouTube stats you should really be tracking if you want to “make it” on the video platform.
Total and Average Watch Time
Clickbait might seem like a good idea, both in the context of blogging and on YouTube. That’s how you get those page and video views, right? However, misleading clickbait will ultimately be to your detriment, because readers and viewers will leave unsatisfied. If you have a whole bunch of views, but most people leave after only a few seconds, those views are meaningless.

Far more important than your view count is your watch time. Indeed, as I mentioned while discussing my YouTube re-monetization process, the two benchmarks you need to achieve are 1,000 subscribers and 4,000 watch hours in the past 12 months. YouTube isn’t interested in the number of views and neither should you. Get that total watch time up!
Impressions from YouTube Recommendations
Just like every other social media platform, you’re also at the mercy of YouTube’s algorithm when it comes to reaching your audience, not counting direct views you might get from sharing your video with your followers elsewhere or embedding the video on your website. Even if someone is subscribed to your channel, your newest video may not appear on their YouTube homepage.
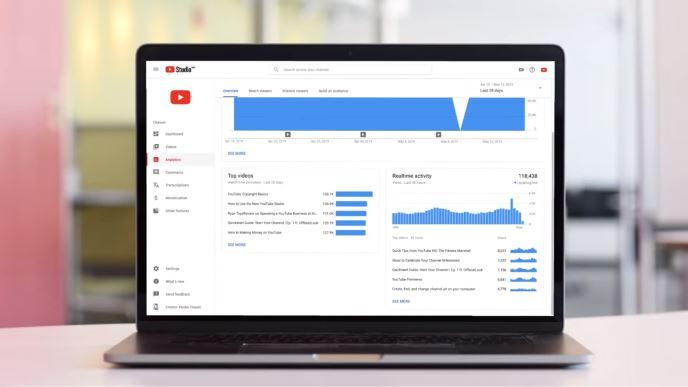
If you look under the “Reach viewers” subsection of your YouTube Studio analytics, you’ll see a box that talks about your impressions and how they led to watch time. At the top of this inverted pyramid is an indication of the total number of impressions (in the past 28 days, by default). That’s how many times your video thumbnail was “seen” by YouTube users. Also in that box, you’ll see the percentage of impressions that came from YouTube recommending your content (as opposed to viewers seeking out your content directly, like through search).
If you then hover over the “i” icon in that area, you can see it further broken down by recommendations on a watch page or recommendations on the homepage. Broadly speaking, these percentages give you a sense of how much the YouTube algorithm likes your content. Unless you rely heavily on more direct approaches, you want these recommendation numbers to go up.
Thumbnail Click-Through Rate
On that same “Reach viewers” page, you’ll also see the impressions click-through rate. It’s also displayed in the inverted pyramid discussed above. This is the percentage of users who saw your thumbnail (either on the homepage or on a watch page) and decided to click on the thumbnail to watch your video. This is a VERY important metric to track, because it gives you a much better sense of missed opportunities.
Maybe the video you made would be GREAT for this user, but the thumbnail or video title weren’t enticing enough for whatever reason. To be fair, the CTR will vary based on a number of factors, like the type of content and audience, and you’re also competing against other thumbnails from other users, like in search results and subscription feeds. For context, half of all channels on YouTube have a CTR of 2-10%.
Remember what I said about misleading clickbait above? A clickbait thumbnail or title may temporarily increase your CTR, but if this also leads to lower average view duration, YouTube will recognize you’re not providing content that users actually want to watch and this will hurt your ability to get recommendation impressions.
End Screen and Card Clicks
Two great features that you should definitely be using on every video are YouTube cards and the YouTube end screen. This empowers you to recommend your own content to your viewers directly in the video itself. (Of course, you can put links in the video description too.)
If you switch over to the “Interest viewers” tab of your YouTube Studio Analytics, you’ll be able to see your top videos by end screen, top end screen element types, and top cards. This gives you a better sense of what elements are getting the most engagement, offering insight into how you might better implement them in future videos. For example, I find that I get more end screen clicks on videos I choose manually rather than relying on the “best for viewer” suggestion.
Taken on their own, any one of these key YouTube stats may only make a small impact on your overall performance on the platform. Taken together, along with everything else that goes with having a successful YouTube channel, they could mean the difference between YouTube stardom or YouTube mediocrity.