Designing application is a huge business and people are making millions of dollars by selling everyday apps that makes someone’s work easier. Mobile devices like Google Android and Apple iPhone’s operating system have dedicated their time and money to create an environment that people can use to streamline the app creation process. It’s a great business strategy that has generated millions of dollars for mobile companies and continues to grow over the years. The concept is very simple…
You give people complete control for creating and uploading an application that takes a small fee per sale. It allows people with a creative sense to grow a flourishing market for mobile companies. If these companies were going to take on the tasks themselves, it would require huge man power and millions of dollars. Using a simple app creating environment, as a user, you can pretty much do everything you want to create an application that can change the world. There are many benefits to this process but only if you can create an application without any errors and problems going forward.
Here’s something that was asked by Google’s application division…
Is your Web page or application taking too long to load? Trying to figure out why?

Many people have had problems in the past trying to find a quick way to diagnose loading issues on their application. However, Google just announced that its Cloud Trace diagnostic service, announced last June (2014) during the I/O conference, has entered the beta stage.
What is Cloud Trace Tool?
It’s an awesome tool that was created by Google to enable application developers to streamline the process of finding performance issues within their application. This way, you can identify the problem quickly and get everything tweaked so you don’t lose existing or new customers going forward. The tool is very simple to use and will be available to everyone using the Google application environment. It works by identify or “tracing†where the slow responses are occurring and downloading the report after. Here’s what the report will let you know…
The report will show you what part of your application takes the longest to load. This way, you can pinpoint the exact location your performance is suffering in and get your team working on it right away. The cool thing is this same tool can be used to check if the newer release of the application is better than the older.
Working with Cloud Trace Tool?
If you want to get started, simply head over to Google Developers Console. Next,
Within the left-hand column, you’ll be able to see Monitoring>Traces. At this point, the trace list will open by default and you simply need to click on “Settings†tab and enable traces so the tool can start running its diagnostics. It’s important you have owner or editors privileges to be able to access the information correctly.
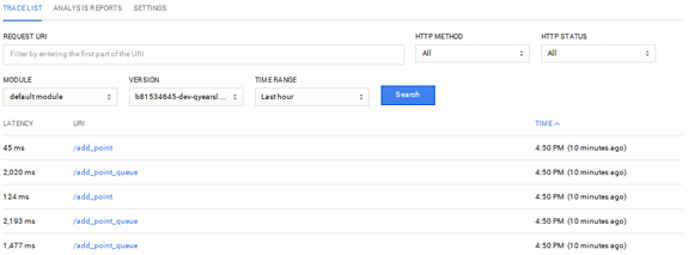
Once everything has been configured, the tool will start generating the required reports, which you can view after a few minutes. You’ll notice a “Trace List†tab appear toward the top of the menu, which you’ll click to generate the required report for your application. Viewing this report is very easy as it displays everything from most to least recent. In this report, everything will be provided by URL and you can click any URL in the column in the Trace List view to view details about the request.
Things to Remember
The tool is currently in its first phase so still has some tweaks that need to be made. There is no guarantee the tool will provide traces for all requests. Next, you’ll have to have an application created within the Google Developer Console for the tool to be used and provide adequate reports. There might be a slight delay when you first enable the tool as it is generating the first report.After that, the “Trace†will be done automatically because it’s been pre-configured.