Google Analytics is a tool that almost everyone who owns a website uses in tandem with other analysis software. You can easily spend hours scrolling through data points with a wide range of metrics available through Google Analytics.
But mindlessly scrolling isn’t going to get you anywhere. You have to understand the metrics you’re looking at and put them to good use.
We are going to look at some of the most important insights you need to track on your Google Analytics account and how those factors can increase your sales and help you build a great business.
Bounce Rate
Google’s definition of a bounce rate is “a single-page session to your site.†While the actual definition is a little more nuanced and there are plenty of things you can do to change your bounce rate, such as making a user interaction “non-actionable†so that it does or does not count towards the bounce rate.
Regardless, your bounce rate is a vital statistic that you need to keep your eye on when tracking Google Analytics. The percentage will essentially tell you how many people are leaving your website quickly, or without clicking out of the page that they landed on.
What is a “good†bounce rate?
Basically, everything from 41 percent to 70 percent is considered average. If you manage to get below a 41 percent bounce rate, you’re running a website that keeps people around, and that’s excellent for boosting sales. If your bounce rate is above 70 percent it may be time to go to your website as a user and see if you’re suffering from long load times or errors.
User Demographics
When visitors come to your website, there is a good chance that they are logged into their Google account. As a result, Google Analytics is able to grab the demographics of the people who go to your site.
You can reach your user demographics by going to the audience tab, and then demographics. You’ll see data such as the age and gender, listed below.
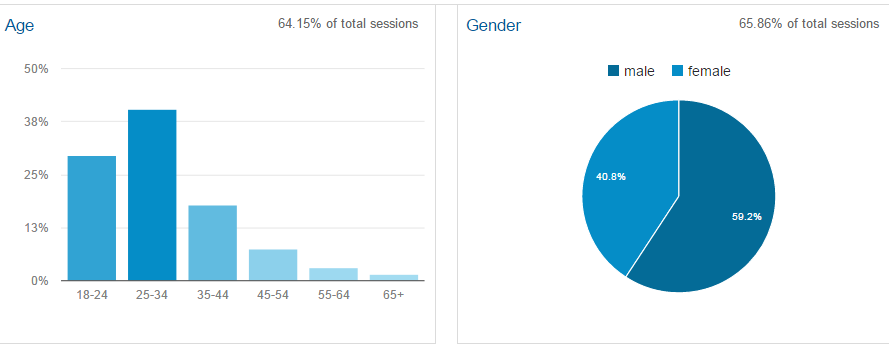
(Google Demographics Example: https://www.intechnic.com/blog/google-analytics-audience-analysis-and-demographics-reports/)
Why is this data important?
Simply put if you know your demographic you can easily make content and advertise to this user base. As an example, let’s say you want to start an ad campaign on Facebook. You check your demographics and discover that your main audience is like the example above, males between 25-34. You can take that data and run ads that target this audience, which can increase your sales over time.
Page views
Another important analytic metric you must track is your pageviews. There is a big difference between user sessions and page views that you should know.
User sessions include the entire duration of the online session per user. In other words, one person, one session. Page views, on the other hand, represent individual pages and how many time they were viewed. In this sense, one user can generate multiple page views depending on how long they stick around on your site.
Let’s look at an example below.

(Google Analytics Pageview Example: https://webmasters.stackexchange.com/questions/78660/how-can-i-see-pageviews-per-post-google-analytics-wordpress)
As you can see, the post from March 31st obtained the most page views. You can use this data to adjust your Google Adsense and advertisement placement. This will also give you insight as to what kind of content your viewers want to read. You can use this data to help craft better content.
Landing Pages
A landing page is, as the name implies, the page that your audience lands on when they make it to your website. This is an important metric because it helps you figure out how people are finding your website and what page they are landing on.
This data can help you manage your SEO. If you look at your analytics and see that there are plenty of people finding your page with one keyword, while others are barely getting any traffic, perhaps it’s time to work on your SEO marketing and change up your keyword formula.
Knowing your landing page data is important for other reasons too. It can help you figure out how to distribute ads and where you should put the highest paying ads. For example, you’re not going to put your highest paying ad on your least viewed landing page, right?
New vs. Returning Visitors
Finally, you should regularly keep track of your new vs. returning visitor statistics. As you begin to build your brand, you’ll, of course, grow an audience of consistent fans who keep coming back to see what you post.
You can build profiles based on your returning visitors and see who they are, whether they converted, and what you can do to pull in more people like them.
It’s also good to check out this metric to make sure that people are still actively learning about your product or brand. This is important to ensure that your marketing plan is working and you’re expanding your reach to a greater audience.
These five metrics will help you make the most of your experience using Google Analytics. If you combine all of these factors together you can create an effective business plan based on hard data. There is no better way to grow your business than by using facts and data that you can track over time.
As you collect more data on your analytics, you’ll discover what works, what doesn’t and how you can get more visitors, more conversions, and higher profits.