If there is at least one key lesson that we can all learn from TV shows like Dragons’ Den and Shark Tank, it’s that you need to have a strong grasp on your numbers if you want to succeed in business. How much revenue did you pull in last year? How many customers do you have? What is your cost to produce each unit? The same philosophy applies to blogging and Internet marketing too.
When it comes to the performance of your website, there are a few key metrics that immediately come to mind. Many people talk about the unique visitors that you get each month or the number of total page views. It’s easy enough to setup Google Analytics for your blog to gain access to these numbers, but the robust reporting tool also records a lot of other key data that you should take to heart too.
Many bloggers might pay attention to their referral sources, understanding whether they’re getting more visitors from search engines or social media, for example. And here are three other important stats in Google Analytics that you absolutely must monitor.
Screen Resolution
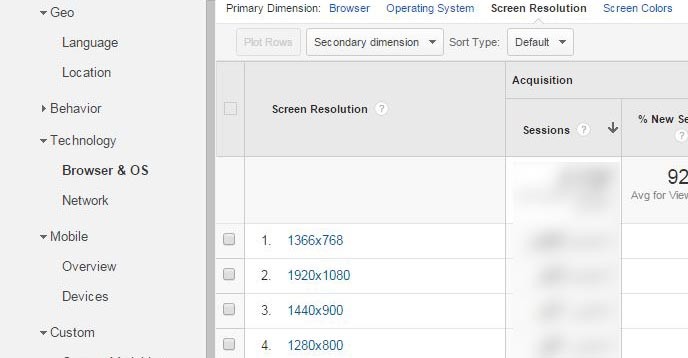

The first is the screen resolution used by your blog readers. This is positively paramount for a number of critical reasons. First, you don’t want to have a blog design that cannot be suitably viewed by your readers. You might have a great-looking theme, but if your content is cut off on either side for the majority of your readers, you’re only providing a bad user experience.
Responsive design and mobile-optimized designs can help to address some of these concerns, but there’s at least one other reason why you should be paying attention to the screen resolution of your readers. It pays to know where “above the fold” ends for most of your readers. This allows you to optimize the placement of your call-to-action and other important page elements.
Web Browser
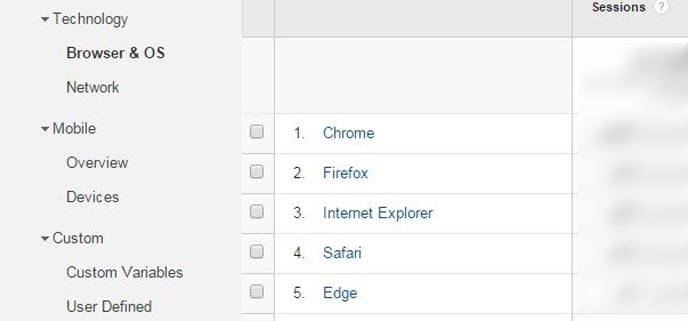
Do not assume that most of your readers are necessarily using the most popular web browser. I remember for quite some time, a larger number of my readers were still using an older version of Internet Explorer for some reason. Given this, I took some time to try troubleshooting my site design to accommodate these readers.
These days, most of the people who read Beyond the Rhetoric are doing it through Google Chrome, so I pay the most attention to ensuring compatibility with this browser. When you’re in Google Analytics, you can drill down even further to see which version of each browser they are using. You’ll also notice that the Microsoft Edge browser, new in Windows 10, has emerged onto the list too.
Language
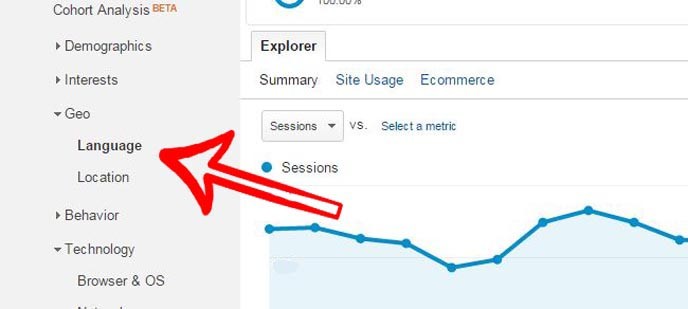
If your blog is written in English, then it’s pretty safe to assume that the main language used by your readers is also English. Even so, that might not necessarily be the case and, even if it is, you want to know what version of English they are using.
For instance, I am Canadian. My blog is hosted on Canadian servers. Given this, many people would also assume that most of my audience also reads and speaks in Canadian English. And they’d be wrong. More than 80% of my readers have American English as the primary language on their computers. That’s far more than both British English and Canadian English combined.
Because of this, I generally try to stick to American English standards for spelling and structure for my blog posts instead of Canadian. Had I not looked at Google Analytics, I may have continued writing in Canadian English and alienated by American English readership.
Take the time to dig around your Google Analytics account. There’s a wealth of valuable data that simply cannot and should not be ignored. By optimizing your website to suit a greater number of your readers, you place yourself in the best possible position to succeed.